TL;DR
Welding Defect Rate Analysis &Rectification Using Six SIGMA Method:Dan FMEA at PT XYZ
ABSTRACT
In order to achieve the company quality objectives and to promote PT XYZ to be the world leading fabricator which produces its products safely, with quality, and meeting the customer’s requirements while remaining competitive, therefore, PT XYZ tries hard to implement zero defect system in its welding production. PT XYZ has monitored the welding defect rate and tried to reduce that rate. To minimize the defect rate down to zero defect, PT XYZ implements Six Sigma method in its welding production system, exercises systematic welding production and implements FMEA (Failure Mode and Effect Analysis) method in order to reduce failure risk in its welding production. The combination of both systems or methods, i.e. between Six Sigma and FMEA above, when synergically implemented would give promising results in the potential reduction of weld defect rate and in achieving of a good quality condition which is product free from failures or zero defect and achieving quality objectives as well as maintaining their customers.
Keywords:FMEA, Management System, Six Sigma, Zero defect,
INTRODUCTION
The industrial growth in the world manufacturing and fabrication industries are increasing rapidly, therefore, this will make companies compete with their competitors and amidst their competitors in the vast growth product technology and operations. The most important factor that the company needs to achieve is to secure their profit, which is gained from their products either goods or services. Achievement to improve effectiveness and efficiency in operations as well financing will be baseline performance that a company needs to achieve and to survive as well as gaining its prosperity.
There are some steps that need to be made by the company management in order to achieve their goals and objectives i.e. to develop strategies and improve the customer's loyalty towards the company products. Though this will mean that the company needs to improve their product quality and shorten their lead time when required. The focus on quality and well as customers will give positive influence to company business and especially to the company gross revenue and financial income.
Based on the production system exercised by PT XYZ, there are still some issues that influence the quality outcomes of their products and one of them is high repair rate issues in the welding production. Therefore, in minimizing or even eliminating the defects in the weld is something that the company should put an effort to in order to improve the products quality and maintaining their customers. The performance itself is a result which needs to be achieved by the company and according to Ratnasari [4] the improvement of company performance can be arranged by managing the workers or manpower resources, this exercise will be implemented through good recruitment, education, and training of the employees. The improvement of workers’ performances will be a continual exercise which gradually improves the company performance as well. The problem which continuously incurs on the production will adversely have an impact on the customer’s satisfaction and eventually to the company sales and revenue. Therefore improvement steps shall involve very core management and cooperation of all company personnel. The high weld defect rate which was exceeding the intended KPI (Key Performance Indicator) will alert the company for systematic mitigation and immediate resolution which need to be done on the production system, especially in the welding department.
Six Sigma and FMEA methods or approaches when implemented can be the best tools to discover what are the real root causes of the problems of increasing defects rate and how to confine the problems or mitigating them and to achieve normal lean operation. Six Sigma can be the controlling instrument which has a focus on the customer’s satisfaction, the higher Sigma level target is the higher company performance will be [6].
Based on that specified background as described above, the writer raised this issue of an article in his research which aims to the problem of how to minimize or eliminate the high welding defect rates of welding operations during in-process inspections and to prepare welds as the outputs in meeting the targetted KPI requirements, to achieve lean manufacturing and on time delivery project.
LITERATURE REVIEW
What is Six Sigma
According to Montgomery that at the beginning there were two types of Six Sigma models or operations used in the industry i.e. Motorola Six Sigma model or program dan Quality Six Sigma program. Motorola Six Sigma program was developed by Motorola in the year 1980’s using normal distribution curve (see Figure 1), while quality Sig Sigma program also used normal distribution curve but with the average value shifted by ± 1.5 from the target (see Figure 2). Motorola Six Sigma program reaches the limit down to 2 parts per billion defectives (0.002 ppm defects) while quality Six Sigma program is calculated only to 3.4 per million defects (3.4 ppm defects). [1]
Figure 1. Motorola Six Sigma Program
Figure 2. Quality Six Sigma Program
According to Pande that Six Sigma means almost the achievement of perfect goal or objective to satisfy customer requirements. Six Sigma is a method or technique to control and improve the quality systematically and serves as a new approach in the quality management system. Moreover, Pande stipulated regarding the five steps in implementing Six Sigma concept which are:
1) Identifying core processes and key customers,
2) Establish customer’s requirements,
3) Measure baseline performance,
4) Prioritize, analyze, and implement improvement,
5) Arrange processes for Six Sigma performances. [3]
Syukron also later defined that Six Sigma requires five stages of implementation which are known as DMAIC method or detailed as Define, Measure, Analyze, Improve and Control [6]. These five stages will be discussed in detail in at the later discussion section.
Failure Mode and Effect Analysis (FMEA)
In the beginning FMEA was developed by Aerospace Industry in the USA on 1960’s, at the 1980’s it was used by Ford company, a famous automotive industry, until the year of 1993, AIAG (Automatic Industry Action Group) and ASQC (American Society for Quality Control) confirmed that FMEA became one of the standard core tools for quality. In the year of 2002, International Organization for Standardization (ISO) included FMEA in their ISO/TS 16949 ‘Technical Specification for Automotive Industry’ as a reference tool [2].
FMEA is one of the methods used by the industry experts to understand and analyze whether a system failure can be measured or analyzed, this theory is to determine whether we can anticipate and mitigate the risk in order to avoid or control the failure. FMEA method when effectively implemented can mitigate the risk, avoiding or minimizing the failure or mistakes and preventing from total process breakdown or failure.
FMEA principles actually are the development from many improvement principles known before. This is in line with the concept of the Father of Scientific Management, Frederick W. Taylor, who according to Ratnasari (2012), he composed some important scientific management concepts which are known as below [5]. The scientific management development concept is actually aiming that there always be a better way to perform the work or job or assignment and this will mean as continual improvement. Below are some examples of what Taylor highlighted in his theory.
1. Carefully select the workers until all workers are given responsibilities and assignments which fit them.
2. Improve workers or staff education and focus on their development.
3. Build relationship between management and workers.
Methodology
Place and Time of Research
The research was performed at PT XYZ in Batam Island and the time needed to complete the research is for about 3 months, which was starting from the first week of April 2016 up to end of June 2016.
Survey Data
a. Literature and library surveys were done to study how the Six Sigma and FMEA methods can resolve the rising defect rate issues and how they will improve the business performance of the company.
b. Observation and direct interview with the company management team, i.e. to observe how the weld defect rate can be minimized using Six Sigma and FMEA methods implementation.
c. Use of the internet media as additional information to support this research.
Survey Process
The research process is done by performing the calculation of DPMO (Defect Per Million Opportunity) and Sigma value of each defect rate calculation. The implementation of FMEA model is to define the root cause of the problem and to look for the solution and mitigation of each problem which caused the rising of defect rate. After the research process has been done and escalated to decision making using RCA (root cause analysis) method and Cause-Effect Diagram which was done by Senior Welding Engineer or Welding Manager in the formulation of corrective actions to the process.
Organization of PT XYZ
Regarding the company organization function and its chain of command or its main activities or manpower management resources and production management as the production facility, PT XYZ is led by a company Director who is managing all activities of the company and responsible for overall quality aspects.
RESULT AND DISCUSSION
Define Stage
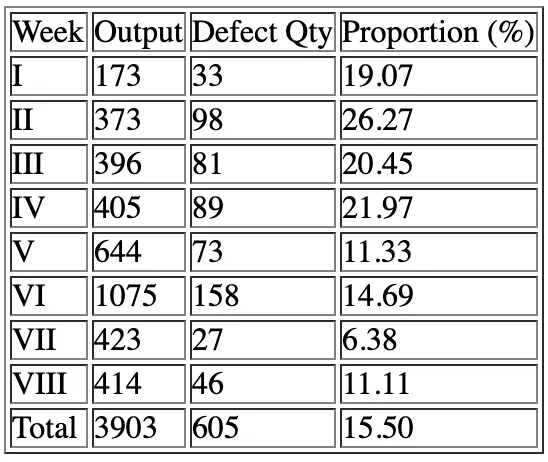
In this define stage we know that the average of total defects which are calculated within each month i.e. from the month of October to November 2015 was 15.5% (see Table 1), while in accordance with the company KPI (Key Performance Indicator) that the acceptable value or total defect percentage is maximum 10%. This high defect rate will have an impact on the customer satisfaction which will be indicated by the company receiving more customer complaints and company start suffering budget restraint due to repair works cost and overspent man hours. All this if not resolved will lead to a substantial loss in profit margins. Therefore, the cost of poor quality (COPQ) will be high and will significantly impact the company revenue.
In this defining stage it was recorded that weld defect rate calculated on average during the month of October and November 2015 is 15,5 % (see Table 1), while according to company KPI target the maximum defect rate is 10%. The impact which is occurring from this high repair rate will affect the company satisfaction and invited customer complaints and compelling request of immediate corrective actions and mitigation to this quality problem. Besides the rise of customer complaints or customer dissatisfactions, this high defect rate problem also gave concerns on the repair cost or production re-works cost or known as the cost of poor quality (COPQ). This COPQ will include not only cost of re-works or repairs but also includes the investment of new machines or tools, training cost, etc.
Table 1. Welding Defect Proportion
Measure Stage
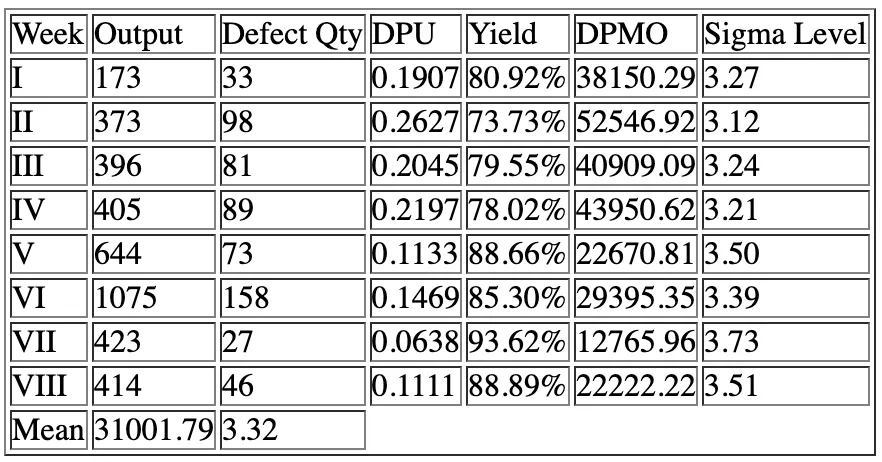
In this measure stage, some analysis has been done to determine the current process condition or current baseline before the Six Sigma improvement methodology is used. This stage is to define the critical to quality (CTQ) aspects and to measure the product performance by calculation the DPMO, which is to calculate how many defects occurred during a period of production and convert them into DPMO and Sigma level values. The previous research data had shown that the average Sigma level during that stage was Sigma 3.32 (see Table 2). This condition is still far from what the company expected which is to achieve minimum Sigma level of 4.0. In the below table we can see the condition of Sigma level during that periods.
Table 2. Sigma Level Calculation
Analyze Stage
Analyze stage is the next hierarchy stage which is also called as the measurement stage. In this stage, the writer is analyzing and identifying the problems which caused the problems to happen. Finding the right problem causes will help us getting the right solutions to the problems and the understanding of the precise root cause will help the company to perform the corrective actions and to prevent the same problems to happen in the future. There are some methods which can be used to analyze the root cause, e.g.:
a. Pareto Chart Analysis
This chart will help the researcher to record and analyze the information of what causing the problems. From the below diagram it can be identified that the highest defect numbers fell on the slag defects, which is a defect caused by improper cleaning and entrapped foreign objects or materials into the weld pool. From the below Pareto analysis, which was recorded before the company performed any improvement or corrective action, we can see the proportions of defects which contributed to the high defect rate problems.
Figure 3. Pareto Chart – Type of Defects
b. Cause-Effect Diagram
This diagram below shows what will be the correlation between the problems or if there is any common factor that simultaneously affects the product or process. Below are some factors which may influence the weld product quality or factors that if studied carefully can improve the current weld quality and remove the undermining problem. Below are some factors which influence the current problems in welds and when it is drawn nicely will give us the fish-bone-like graphics or diagram (see picture 4) below are:
1. Man
2. Material
3. Machine
4. Method
5. Environment
Figure 4. Cause-Effect Diagram
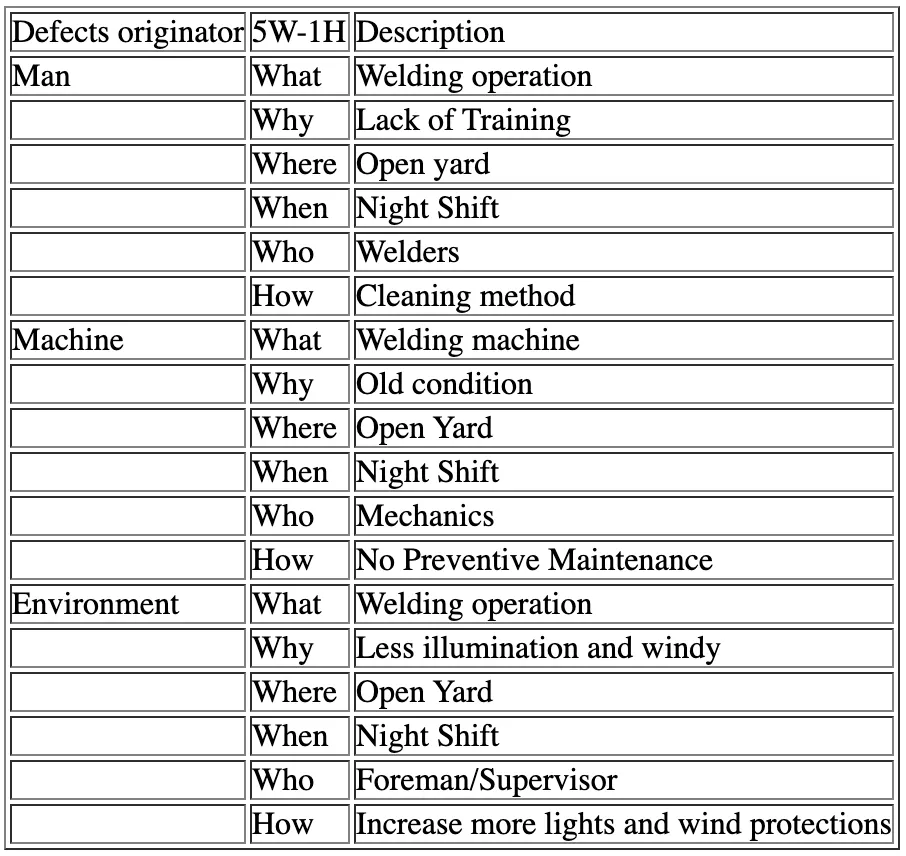
c. 5W-1H Analysis
This concept is used to determine what will be the solution to the weld defects which occur during welding or production. 5W-1H method or analysis can be seen at the below table:
Table 3. 5W-1H Analysis
d. FMEA Analysis
This analysis is a method used to understand or observe whether a failure can be analyzed or measured and being anticipated or minimized whether its failure rate of its negative effect on other factors or its process output. Actually, there is a similarity between FMEA and cause-effect diagram which was discussed previously when finding the root cause of a problem, however, with FMEA we can prioritize which problems that are more significant. FMEA gives us three criteria to each problem to be analyzed, those criteria are Severity (S), Occurrence (O), and Detection (D). These three criteria will form a value which is called as Risk Priority Number (RPN), and by using the formula S x O x D = RPN, and now we can give priority which problem will require immediate action due to its high risk. The higher its RPN is the higher its risk and the higher is its urgency to be resolved. Below are some details of each criterion which forms the RPN:
1. Severity (S)
This criterion shows how severe is a problem and how this will affect the product or process quality. This criterion sometimes ranks from 1 to 10, where 1 represents the lighter one and 10 represents the heavier or the worst one.
2. Occurrence (O)
This shows how often is the occurrence of the problem in the production or process. This criterion also is normally ranked from 1 to 10, where 1 represents the hard occurrence and 10 is very often occurrence.
3. Detection (D)
This criterion shows how easy is an incident can be detected before or after it happens during production or process. The criteria are also ranked from 1 to 10, where 1 is the easiest to detect and 10 is the hardest to detect.
Below is the FMEA analysis (Figure 4) which was developed by the company to perform the analysis in resolving the high defect rate issues in its weld production section or unit.
Figure 4. FMEA Analysis
Improve Stage
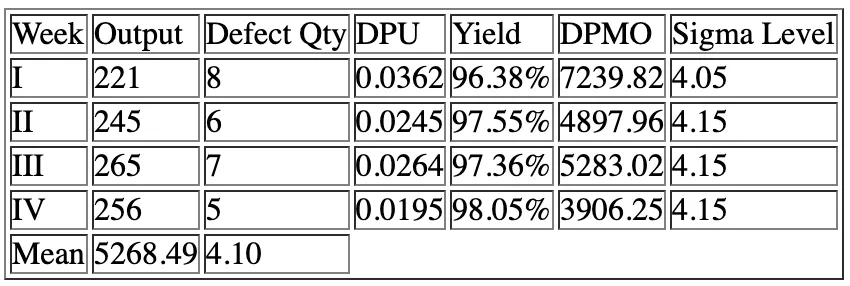
Improvement stage is performed by implementing all the analysis and methods prescribed in this paper i.e. Pareto analysis, cause-effect diagram, 5W-1H concept and FMEA analysis. After all the plans and strategies are implemented then we can measure that all Sigma level average values are improving, this will be shown in the below table (see Table 4).
Table 4. Calculation of Sigma Level after Rectification
Control Stage
This stage or activity is the final operational stage in improving the quality of products in conjunction with the implementation of Six Sigma and FMEA methods on the production of products or services. At this stage, all the quality records and reports are distributed to relevant parties to be evaluated if the actions taken are meeting with the requirements and give results. This stage also includes documenting all procedures and records for future review or study and for the benefits for future training.
Conclusion
The conclusion which can be made from this paper is that the writer proposes some inputs to the company in order to tackle with the facing problems, which are as below:
- By using Six Sigma and FMEA methods the company can grow more acceptable outputs, achieving the quality objectives, deliver the products on time, and improving the lead time.
- Using these two methods above the company can achieve its periodic KPI, especially when its in-process inspection during production welding can achieve the proposed target of maximum 10% defect rate or repair.
- Using this technique also the company can minimize the cost of poor quality (COPQ) and this also will be in line with the escalation of company profits or values and make the product price more competitive.
- This method also encourages the implementation of quality improvement and develop quality perception amongst customers. These methods are also giving company assurance that the products are well guaranteed.
- The implementation of this paper can improve company image and fulfill the company mission and vision, as the most leading global fabrication company.
References
[1] Montgomery, D.C. 2009. Introduction to Statistical Quality Control. USA. John Wiley &Sons.[2] McDermott, R.E., Mikulak, R.J. &Beuregard, M.R. 2009. The Basics of FMEA. USA. Productivity Press Group.[3] Pande, S.P., Neuman, R.P. &Cavanagh, R.R. 2003. The Six Sigma Way. Yogyakarta. Andi.[4] Ratnasari, S.L. Pengaruh Kompetensi dan Kompensasi Terhadap Kinerja Karyawan Departemen Quality Assurance PT. PEB Batam. Batam. Fakultas Ekonomi Universitas Batam.[5] Ratnasari, S.L. 2012. Frank B. Gilberth, Lillian M. Gilberth dan Perkembangan Ilmu Manajemen. Surabaya. UPN Press. [6] Syukron, A &Kholil, M. 2013. Six Sigma – Quality for Business Improvement. Yogyakarta. Graha Ilmu.